
Take a bearing, don't estimate
Estimation in software development is putting the burden on the wrong shoulders. Ultimately the software developers are carrying it – even though they have the least control over living up to their promises. Also they are the ones with least experience in tracking budgets.
Estimation, i.e. prediction is the duty of leaders. They are responsible for compiling enough data to get it right. And that does not mean delegating the very task to someone else. In essence that means: You want an estimation? Get your act together and do it yourself.
Sure, this doesn’t sound comfortable - but it’s the only honest and responsible way to do it, I think. Never mind prevalent practice. Because prevalent practice not only doesn’t do it like this it also produces far off results. As long as you don’t have a track record of accurate estimations (e.g. 95% of estimations are only max. 5% off in terms of quality and budget), I wouldn’t deem you an authority on the matter. And if you have such a track record, please tell the community how you’re doing it - of course in a way the community can verify your claim. But then… I guess you wouldn’t be reading this if you’re getting estimations right almost all the time ;-)
Take a Bearing
But not only the wrong people as tasked with estimations, I think we’ve gotten it all wrong by calling “it” estimation in the first place.
What’s the whole purpose of “it”? To make a prediction, to look into the future in order to make a decision about the further course from where you’re right now. You’re here and you’re trying to figure out whether to go left or right. You’re wondering how much progress you’ll be able to make in the future given a certain set of new tasks. How much budget will you need (be that time and/or money)?
That’s the same question a captain of a vessel is asking himself all the time. Where are we? How to progress from here?
But have you heard about captains asking the helmsman what he estimates the progress of the vessel will be? Or does a captain ask the machine operators what they estimate riding out the storm will cost in terms of fuel? Hm… I haven’t. Because that’s what a captain is supposed to know. That’s what his experience is about. (On the other hand I'm no naval expert. So what do I know...? ;-) )

You see, a captain has lots of data to base his decision on about direction, speed etc. That’s a completely different situation compared to software development. In software development the “captain” (e.g. project lead, product owner) is not taking measurements himself, but is asking others. Because asking a developer to estimate effort is not taking a measure. Measuring is about facts. Estimations are about… wishful thinking.
In addition, the “captain” of software development often has a narrow range of “right answers”. If the estimation of the software developer does not fall within the range this “captain” does not want to hear it. The “estimation game” is continued until the estimations sound about “right” according to the “captains” beliefs.
Think about a ship’s captain acting like that. It would be deemed irresponsible. And it would of course lead to a lot of loss. Maybe the tragic story of the Titanic is an illustration of this kind of delusional approach?
Ok, to make a long story short: Let’s not ask for estimations in software development. Let’s start taking a bearing instead.
Logging Progress
Taking a bearing requires data, hard facts. It requires a database of past positions and a map. Do not ask a software developer for an estimation! Instead go to your database and see what’s your track record of already accomplished tasks.
Forget predicting future progress as long as you don’t have a solid database on past progress. And I mean an explicit database not some fuzzy memory of how things might have worked out in the past. Human memory is fallible and prone to be biased.
Also do not ask several developers for an estimation and then go with the average. This might sound better than asking monkeys for estimations – but in the end it’s the same. As said above: it’s asking highly biased people with no control and no explicit experience in budget tracking to give you a number which pleases you.
It’s a far too emotional and gut feeling based way of navigating the treacherous waters of a project.
What to do instead? Just keep a log of the actual budgets needed for tasks. Log just one number: cycle time. It’s quite easy to measure and close to the actual effort expended. If you want more detail also measure lead time and effort. But don’t try to be perfect from day one on. So better start small, just measure cycle time for each task. The clock is starting to run when a developer picks the task to actually work on it. And the clock stops when she delivers the result.
What you get is a list of tasks with cycle times, e.g.
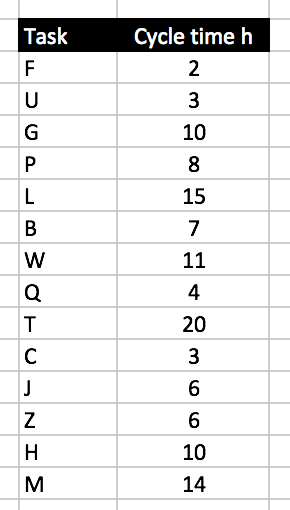
That should be easy enough, shouldn’t it? If you’ve a nicely working agile process it will be clear when a task (or user story) is moved to production and when it’s done. Just have the developers punch the clock twice for each task: once when beginning the work on a task, once when they finish it. Your favorite issue tracker should support that. Maybe this data is even there already waiting for you to ask the right question?
Navigate
Now that you have a comprehensive log of past progress you may start looking into the future and chart your course. You want to know the time budget needed for the next task A? Well, look at your log. How long did it take the developers in the past to accomplish a task?
So far it took them 119 hours to accomplish 14 tasks. That’s 8.5 hours per task on average.
Well, I’d say the next task is likely to take around 8.5 hours. (What does "around" mean? See below...) Or maybe you want to go with the median value of 7.5? That’s fine with me. Both numbers are based on facts, not wishful thinking.
Categorization
You might counter by saying “But not all tasks are created equal!” and you’re right. Putting certain tasks in the same basket with others might skew the result unrealistically. It’s the same as pitting a guy of 75kg against one with 150kg in a boxing ring. That’s why there are weight classes and age classes in sports.
To get a better idea of the budget needed for the next task try to categorize them. Maybe you distinguish between UI, domain (DOM), and data access (DA) related tasks. Or you distinguish bug fixing (BF) from feature development (FD). Or you categorize by age of code: recent code, dated code, old code, very old code.
Choose whatever suites you - except for a task size in disguise. Story points, t-shirt sizes and the like are unsuitable categories. Because the size (expected effort) is the one thing you don't know.
Start out with some categorization regarding the kind of work that needs to be done and then check if it helps you with your predictions. Here's an example:
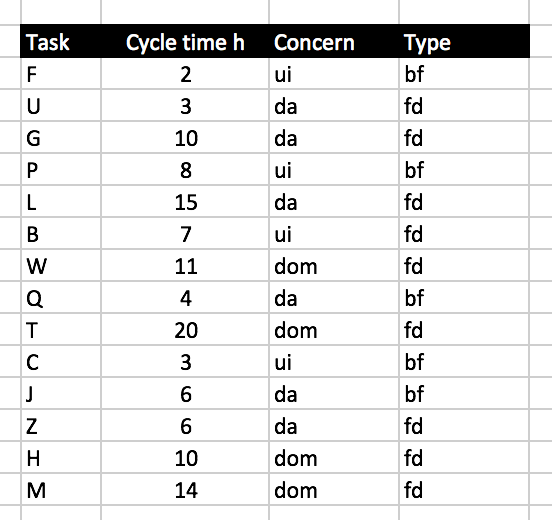
Now, before you try to make a prediction ask the developer which concern and or type a task belong to. No guesswork is necessary to answer that. It’s obvious to every developer whether a task belongs in this or that category.
Let’s say the new task A is a UI task and the new task K is a DOM task. What’s the required budget to be expected? If you go with the average then it would be 5h for A and 13.75h for K.
Nice! More accurate it seems. Without categorization you’d have been too pessimistic for A and too optimistic for K. Such abberation might be neglectable in the long run. But to get a better idea of how to steer your project ship in the near future you might want to be more precise.
Just don’t overstretch it. Don’t categorize tasks too finely. Because then it will be hard to find the right category for the next task. You actually loose predictability because that hinges on fuzziness. In the face of tasks you cannot estimate one by one by just looking at them, you want to group them in sufficiently large categories based on kind.
So what about A not only being a UI task but also a bug fix? The expected budget would be 4.3h vs. 7h for a new feature. Nothing can be said about K, though, if that was a bug fix. No prior data is available. But looking at the bug fix data from other concerns you might expect a cycle time around 4.6h.
How’s that compared to prodding developers to cough up an estimation?
And the beauty of it: With every task finished your database grows. With every task logged navigation becomes more accurate. Just record facts.
If you like your can even draw a burn-up chart from the log. See how the cycle time varies from task to task in chronological order? See how the total cycle time always is on the rise? See how the average needs some time to reach a pretty stable level? From task 7 (W) on the average does not change much anymore. Individual tasks vary much from 3 to 20 hours. But the average progress pretty much stays the same: around 8 hours per task.
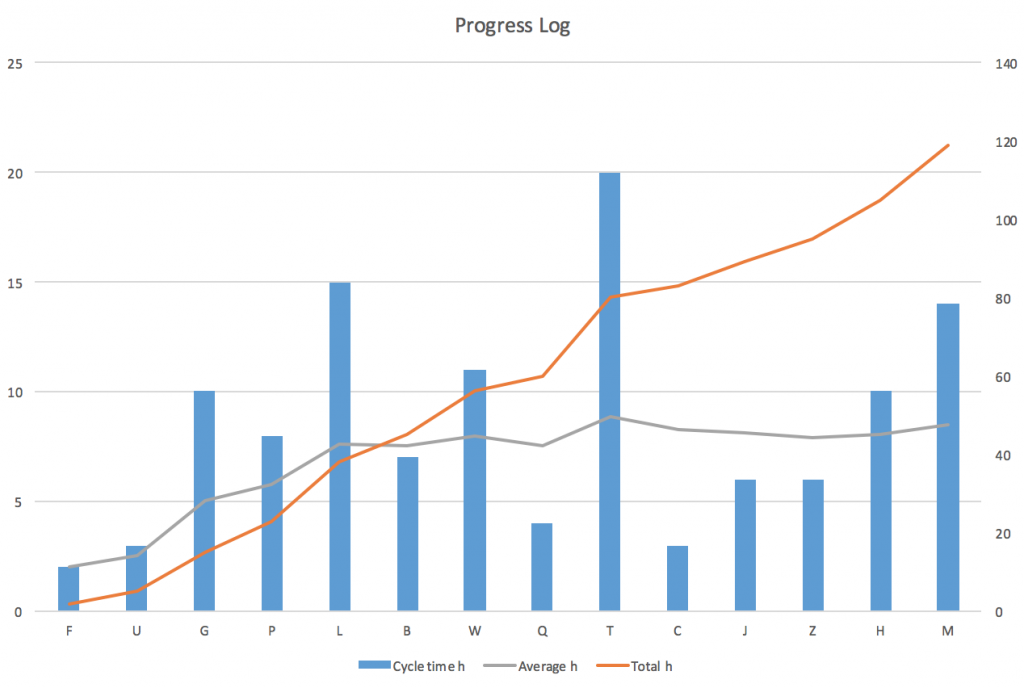
This would not help you to predict the effort of one more task, but forecasting 5, 6, 10 tasks has a good chance of being close to the average, I believe.
Ok, what if there were 6 tasks on your table: A (UI,BF), K (DOM,FD), E (DA,FD), V (DOM,BF), R (DA,BF), X (UI, FD)? Well, you add up all the average expected cycle times: A (4,3h) + K(13,75h) + E (8.5h) + V (4.6h?) + R(5h) + X (10,6h?) = 46,75h.
But notice: V and X have to be calculated from data of other concerns because there are no logged facts about bug fixing the domain or hardly any data on doing feature development for the UI. For now at least ;-)
My guess is: Don’t trust an average of less than at least 3 values. That means, don’t try navigation with less than 3 data points in each category.
***
You can stop here. Start working with averages based on facts instead of wringing illusory estimations out of developers. Try it. See for yourself. Maybe compare results: Continue your estimation game - and also track the facts. Then you can do retrospective predictions and see where they would have led you. Play with facts like people do with stock market data - and rest assured cycle times are less volatile and unpredictable than stock prices ;-)
Or you go one step further and try playing with probabilities:
Risk Management
***See an updated simulation approach in a later posting!
So far navigation is based on averages. That’s single values you add up. But those averages are just that. Which means the cycle times of the next tasks will not be exactly those numbers but will be distributed around them.
Let’s look at the above tasks A to X again. But due to some scarcity of data let’s only focus on their concern. This leads to these averages: A (5h), K (13.75h), E (7.33h), V (13.75h), R (7.33h), X (5h) = 52.17h
Will accomplishing all these tasks take 52.17 hours? Very unlikely. But it will be around that value. But what does "around" mean? How far off will the real value be? Why not run a couple of simulations?
Here’s my assumption: Each concern has an average and a standard deviation [accessible version], e.g. UI (average=5h, std.dev=2.55h). Each task will require between average ± std.dev effort. That’s a simplifying assumption, but it will help to show what I mean by simulation. Ultimately, however, you’ll base the simulation on a more sophisticated distribution of data points per category.
This leads to a list of value ranges like this: A (5h±2.55h), K (13.75h±3.9), E (7.33h±4.07), V (13.75h±3.9), R (7.33h±4.07), X (5h±2.55h).
A simulation can now be done using the Monte Carlo method using a simple Excel sheet. Using the MonteCarlito tool I can simulate expected efforts by multiplying the standard deviation with a random value (-1..1) and add the result to the average:
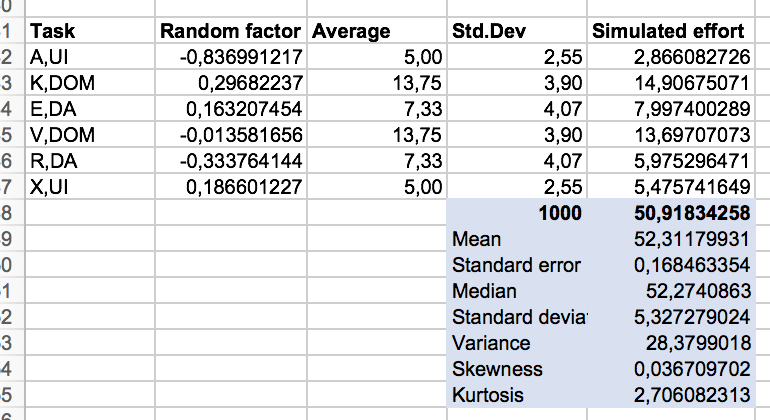
This even produces a nice diagram :-)
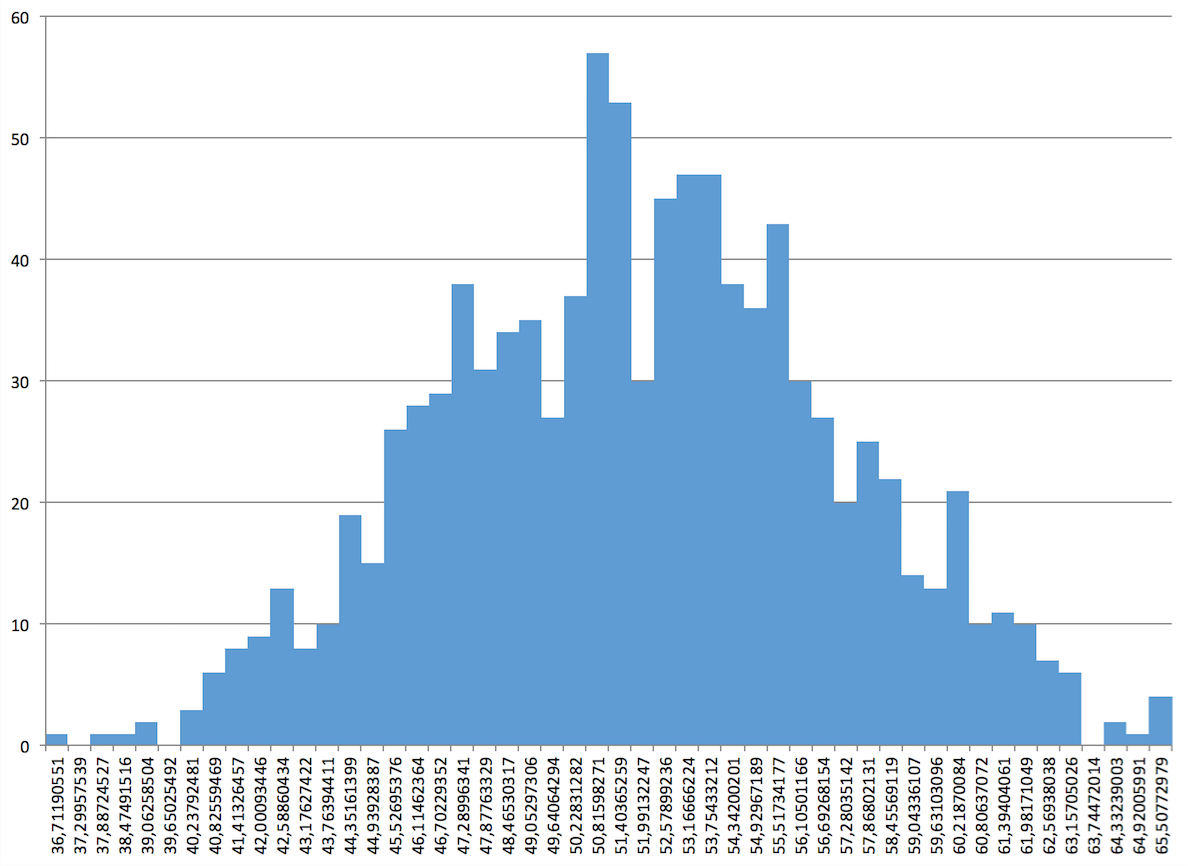
It shows that total effort for those 6 tasks ranges from 36 hours up to 65 hours. Quite a range, isn’t it? But I find this view more based on facts than gut feelings of developers.
Most importantly, though, the average expected effort from 1000 simulation runs is 52.31 hours (not much of a surprise with a normal distribution of random values around averages for simplicity's sake) with an overall standard deviation of 5.32 hours. This means that the probability of the project finishing between 46,99 hours and 57,63 hours is roughly 0.7 (70%).
But this is still abstract. Let’s look at the diagram again. Regardless of what value distribution underlies such a simulation you can look at the resulting data and find a threshold matching your risk sensitivity. If you’re more of a gambler you take course towards 53.75 hours (slightly above average) with a 66% chance of success. Or you’re risk averse and go for 90% and expect the tasks to take 58.45 hours in total.

It’s your choice! But this is an informed choice. Based on facts from the past, not the whim of some group of developers.
***
Disclaimer: I’m not a statistician. So take my application of the Monte Carlo method with a grain of salt. Maybe the same result can be achieved with some easier calculations? Good, go for it. But my guess is simulation will win in the end. Because in simulation you don’t have to tweak some distribution formula but can use actual values.
In my example it’s just a a few data points. But once the number increases you can really start experimenting with simulation approaches. Take 100 categorized cycle times to predict the next 10 oder 20. How well does that go? Let me know. Here’s my hypothesis: You’ll be more accurate in your predictions than by asking developers. But don’t take my word for it ;-) Try for yourself!
3 Tips for Software Project Navigation
- Stop asking developers for estimations!
- Start logging factual task cycle times.
- Determine a couple of categories to put tasks into; maybe start out with 3 to 5 pretty obvious categories based in the kind of tasks. It should be easy to assign new tasks to those categories.
- For new sets of tasks run a simulation based on averages (or distribution) of logged data points.
- Find the risk level you’re feeling comfortable with and check the simulation for a total effort to be expected.
That said please remember: It’s all just probabilities. It can work out - but maybe it does not. Just refrain from blaming anyone. Keep logging. Keep looking at the facts instead. Try to find patterns if things don’t go as expected. Maybe you need to tweak your categorization? Or maybe something more fundamental has changed (e.g. someone left the team)? In the end, though, all will show up in your log. Trust its wisdom ;-) Nothing beats reality.
***Don't miss the updated simulation approach in my later posting!
PS: Please note, this change in your dealing with prediction does not require you to believe in anything. You don't have to apply any sophisticated analysis of your code base or requirements. Also you don't need to change your current development approach. "Just do the math!" :-) Collect data you already might have, start with 80% of it to progressively predict the remaining 20%. How does that work out?
PPS: This article does not make any claim as to whether prediction of any kind is useful in software development. I myself am not much of a friend of any type of forecast. But, hey, if you're required to forecast to retain your job you might as well try it without the usual estimation theatre but with some simulation based on facts instead.
PPPS: By the way, if you haven't done so already grab a copy of NoEstimates: How To Measure Project Progress without Estimating by Vasco Duarte.