Magically Predictable Software Production for Projects
Do you remember the story about the magic black box transforming software requirements into release at no cost at all? I wrote about it in a previous article - and since then have received many questions about how it could be deployed in real software projects. Because what I described were simplistic scenarios with just single requirements.
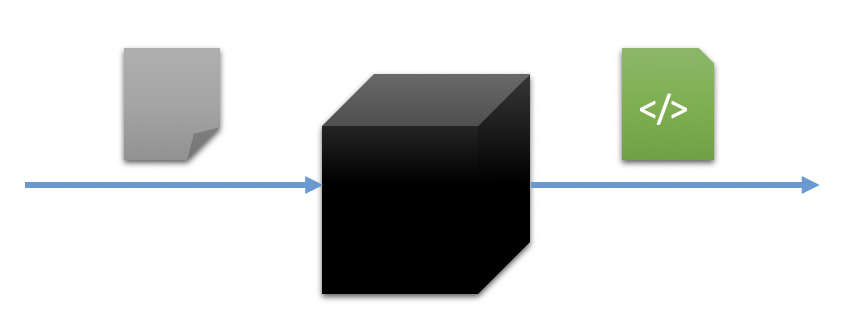
Here’s a short reminder of what this thing is, the magic black box:
Magic Black Box Recap
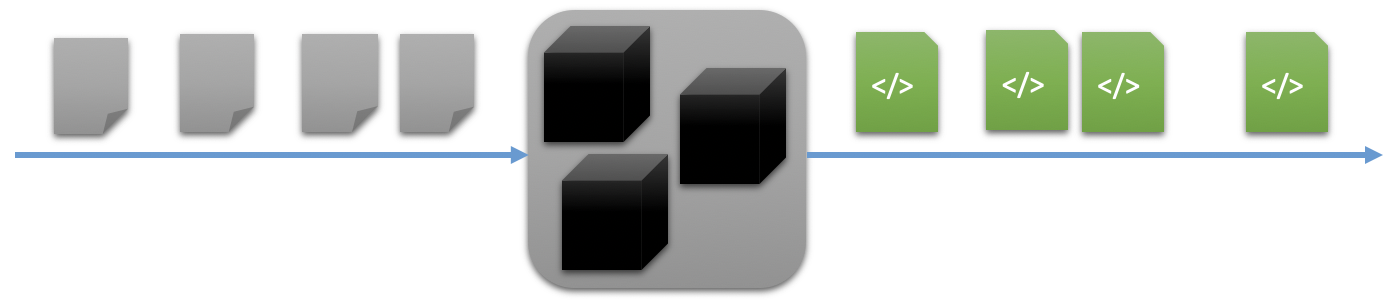
Imagine you are a product owner. One day a black box appears on your desk with the promise to produce high quality software for your for free. Yes, for free! You just hook it up to a GitHub repository and feed it requirements as issues. The black box works on them one-by-one and drops the finished code as releases into the repository.
The only downside to the magic is, that you don’t know how long it’s going to take the black box to transform an issue into a new release.
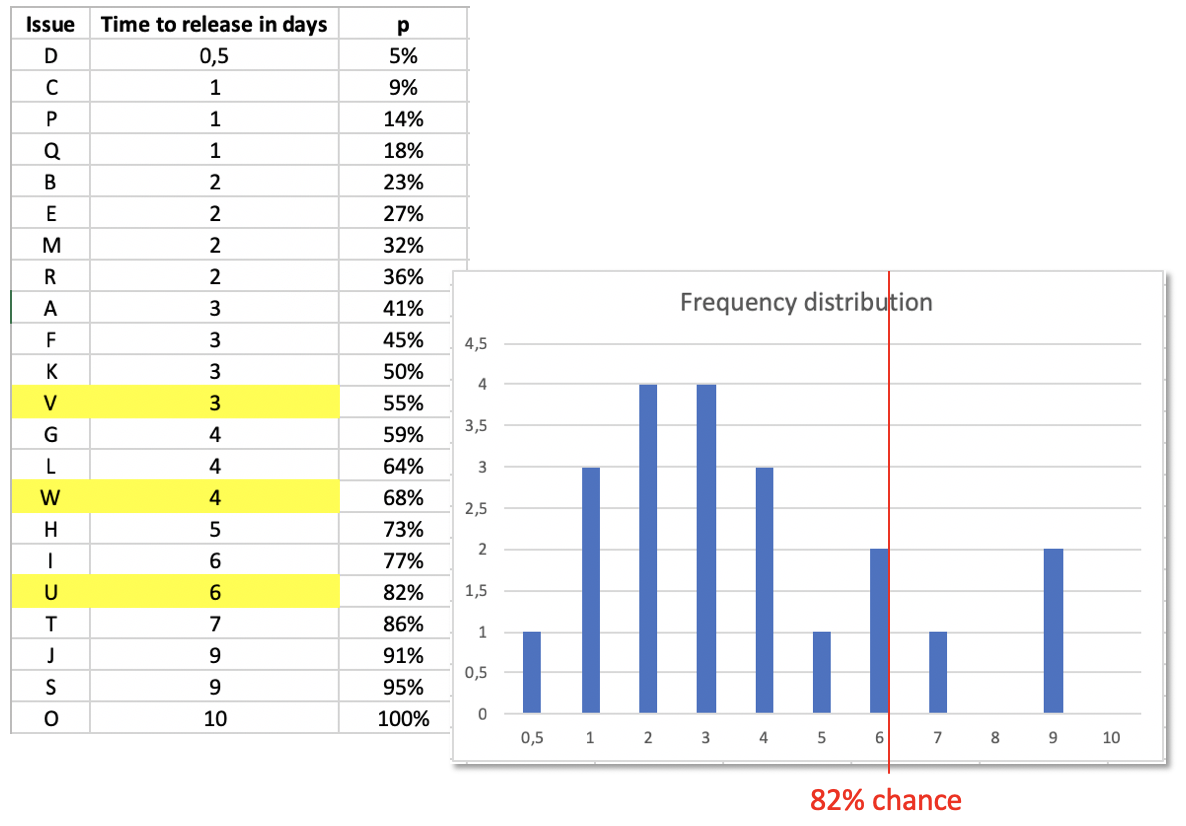
But since the black box did not cost you anything you try it out and record the cycle time for some issues from start to finish. Some issues take 1 day, some 3 day, and there is even one with 10 days.
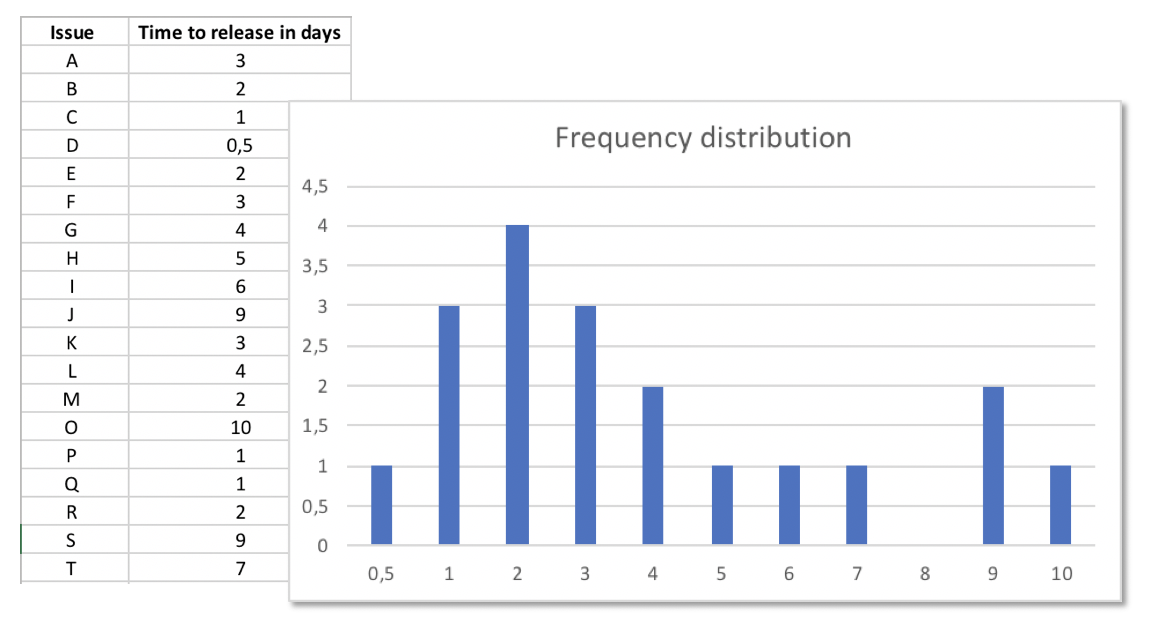
You realize there is some method to the magic. The black box is not at all useless to you, even though you cannot ask it in advance for an estimation of how long it’s probably gonna work on an issue.
Instead of getting an estimate from it, you observe it and make your own forecast.
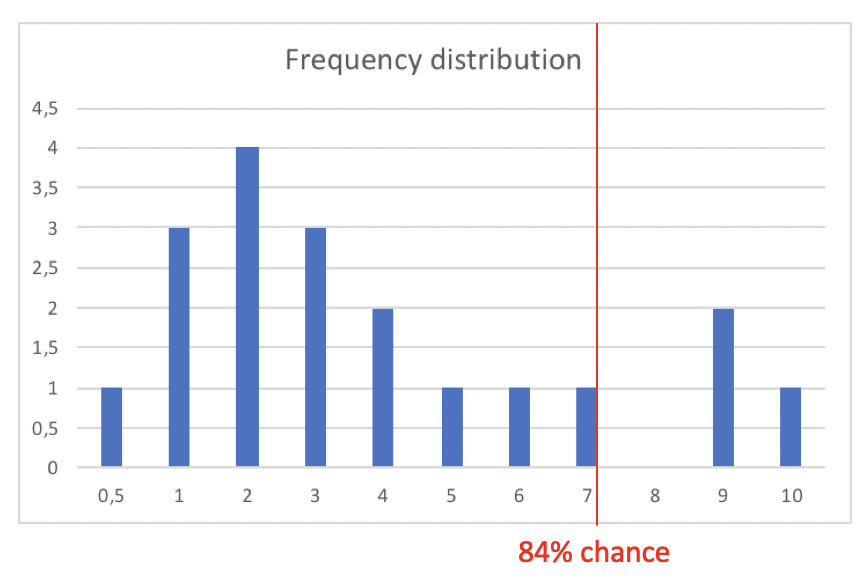
For example: Based on the issues implemented so far the next one has a 84% chance of being finished in 7 days (or even less).
And if you update your log of cycle times with each issue done, your next forecast will be even more realistic. With three more issues implemented you see how the situation even changes towards the better. 6 days (or less) has moved up from 79% probability to 82%.
I think, this is a much more realistic information compared to some developer’s gut feeling. The simple reason: this prediction is based on facts, on historical data. No wishful thinking, no invisible padding, no deadline-driven distortion. And you did not need to go through frustrating discussions with developers.
So much for a quick recap. Read the previous article for a couple of more details.
Single Black Box, Multiple Issues
Forecasting the implementation time for a single feature is not bad. But it’s not more than a start. Managers and customer are rarely asking „How long will only this one feature take?“ Rather they want to know how long it takes to get the next 5, 17, 31 features done.
For example: What’s your answer to „How long will 4 features take?“ if the answer to the single feature question is „With an 82% chance it’s gonna take 6 days.“? Do you just calculate 6+6+6+6=24 and say „It’s gonna take 24 days with a probability of 82%.“?
No, that’s not gonna work. Or: It works, but then your prediction (cycle time for 4 features) is worse than it needs to be and wrong (with regard to the probability).
Instead what you do is run simulations.
Monte Carlo Simulation
A single simulation looks like this: Sample the historical data 4 times (since you want to forecast the total cycle time for 4 features), i.e. pick 4 cycle times at random. This might result in these cycle times: (1, 1, 3, 7). The total cycle time would be 12 days.
Then do it again: (2, 4, 5, 3)=14.
Then do it again: (9, 1, 3, 7)=20.
And so on, and so on… Do it 1000 or 50000 times. That’s called a Monte Carlo Simulation.
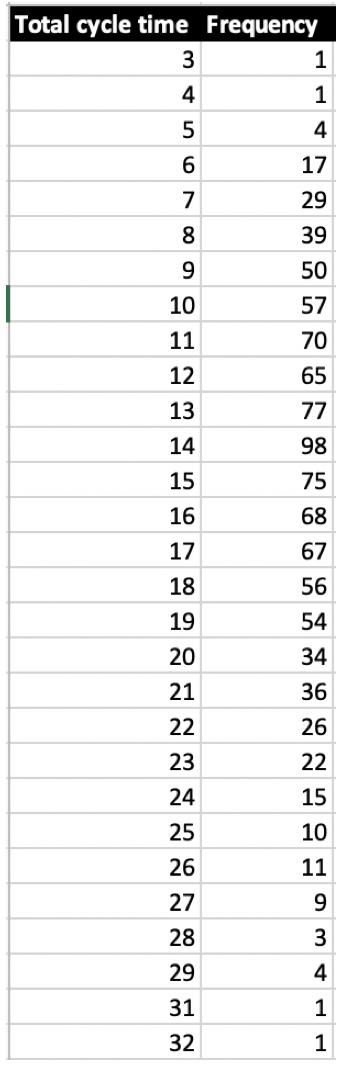
Then for each of the maybe 1000 total cycle times count how often it occurs, e.g. 5=4 times, 9=50 times, 14=98 times, 25=10 times…
Here are the results of 1000 such simulations for 4 features based on the latest historical data from above:
It’s pretty clear that 4 features cannot be done in less than 2 days, since a single issue always took the black box at least 0.5 days. And it’s clear that it cannot be more than 40 days, i.e. 4 times the maximum cycle time so far.
But as you can see from the above simulation both the minimum or maximum might not even happen. At least they did not happen during 1000 „trial runs“.
Now look at the simulation data turned into a histogram. Interesting, isn’t it?
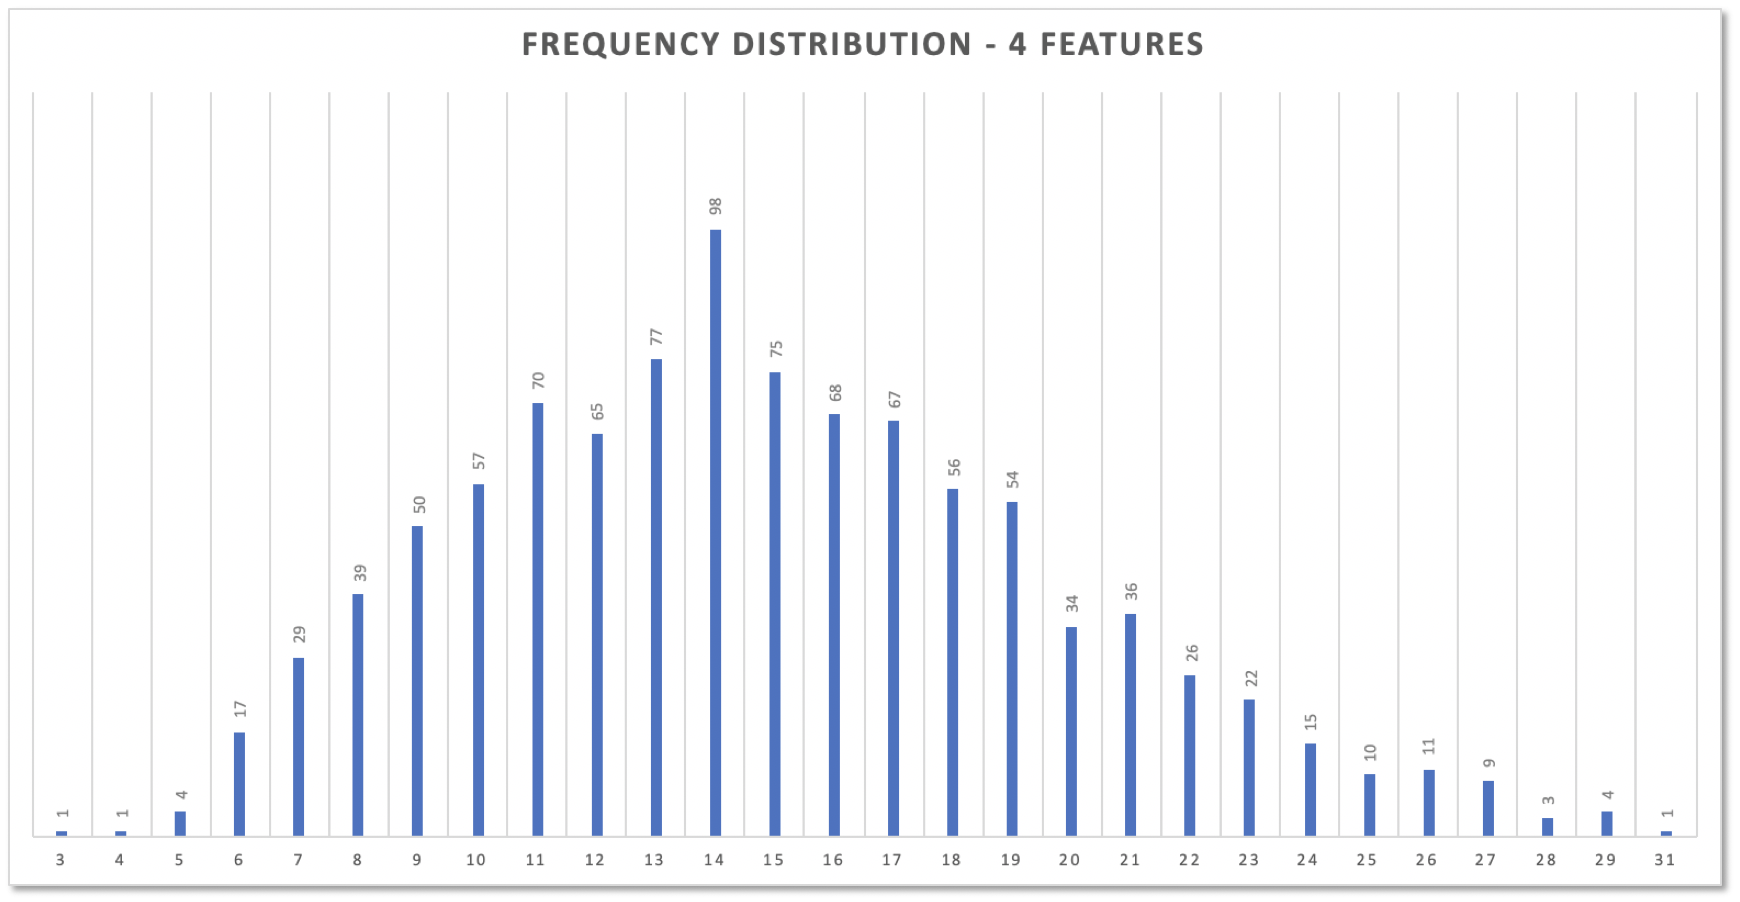
The original distribution had two „humps“ (see above): one at cycle time 2, another at 9. But the distribution of total cycle times does not resemble the original distribution. It’s close to a normal distribution. That’s due to the Central Limit Theorem and was bound to happen. But don’t worry. No need to get deeper into math here.
And of what use is this to answer the question „When will 4 features be done?“? Like with single feature forecasts it’s about percentiles again: How many simulation results are equal or less than a certain total cycle time?
If you still think a bearable risk is 18% then 19 days are your forecast: 82% of all simulation results predicted 19 days or less for 4 features.
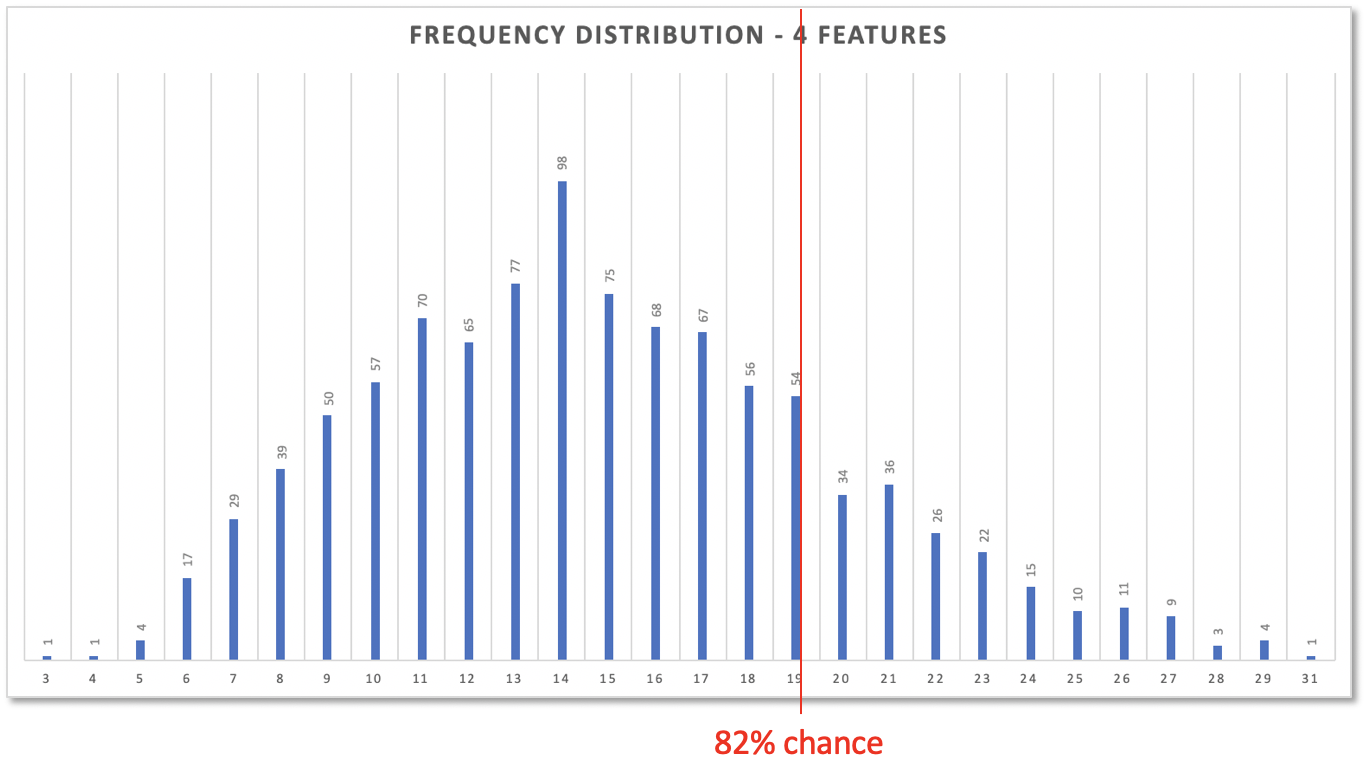
Now you see, why 24 days where too much. 24 days, i.e. 4 times the 82% cycle time for a single feature, would offer you even 96% confidence!
That’s why the usual padding of estimations is so wrong: The manager asks developer A for his estimation of feature 1 and gets 10 days including a (unknown) 30% padding. She asks developers B, C, D for three more features each including a padding of 30%. Even these 4x30% padding are too much; they are the same as 24 for the simplistic total cycle time for 4 feature. But nevertheless she adds another 10% to be on the safe side. This decreases the risk, sure, but not explicitly. Receivers of the updated estimates don’t know about it; it might be contrary to their risk attitude. It probably creates a prospect of higher costs than necessary.
But never mind. Those days of excessive padding are over. With forecasting and a black box the predictions are much more realistic: no hidden padding, no excess padding.
You see, predicting the development of multiple features is possible even if you’re working with a black box you cannot ask for an estimation. The math is simple, the approach straightforward. It can be done in some 50 lines of logic in C# plus a bit of Excel for visualization. That’s no rocket science.
Multiple Black Boxes, Multiple Issues
So far the story about the Magic Black Box assumes you as a PO only get one. Since each Black Box probably works best on a single issue at a time, features get implemented in a sequential way.
That’s great for a single project. Work-in-progress is naturally kept to 1. All issues get implemented in the fastest way possible.
But if there are multiple POs working on parts of a larger project and each one was presented with a black box… How can a prediction for the whole project be done? Multiple black boxes surely are working in parallel. Releases get crunched out in parallel.
Maybe 3 POs with their black boxes are supposed to deliver 10 features. How long is that gonna take? For a single black box working sequentially simulation would deliver a result like this:
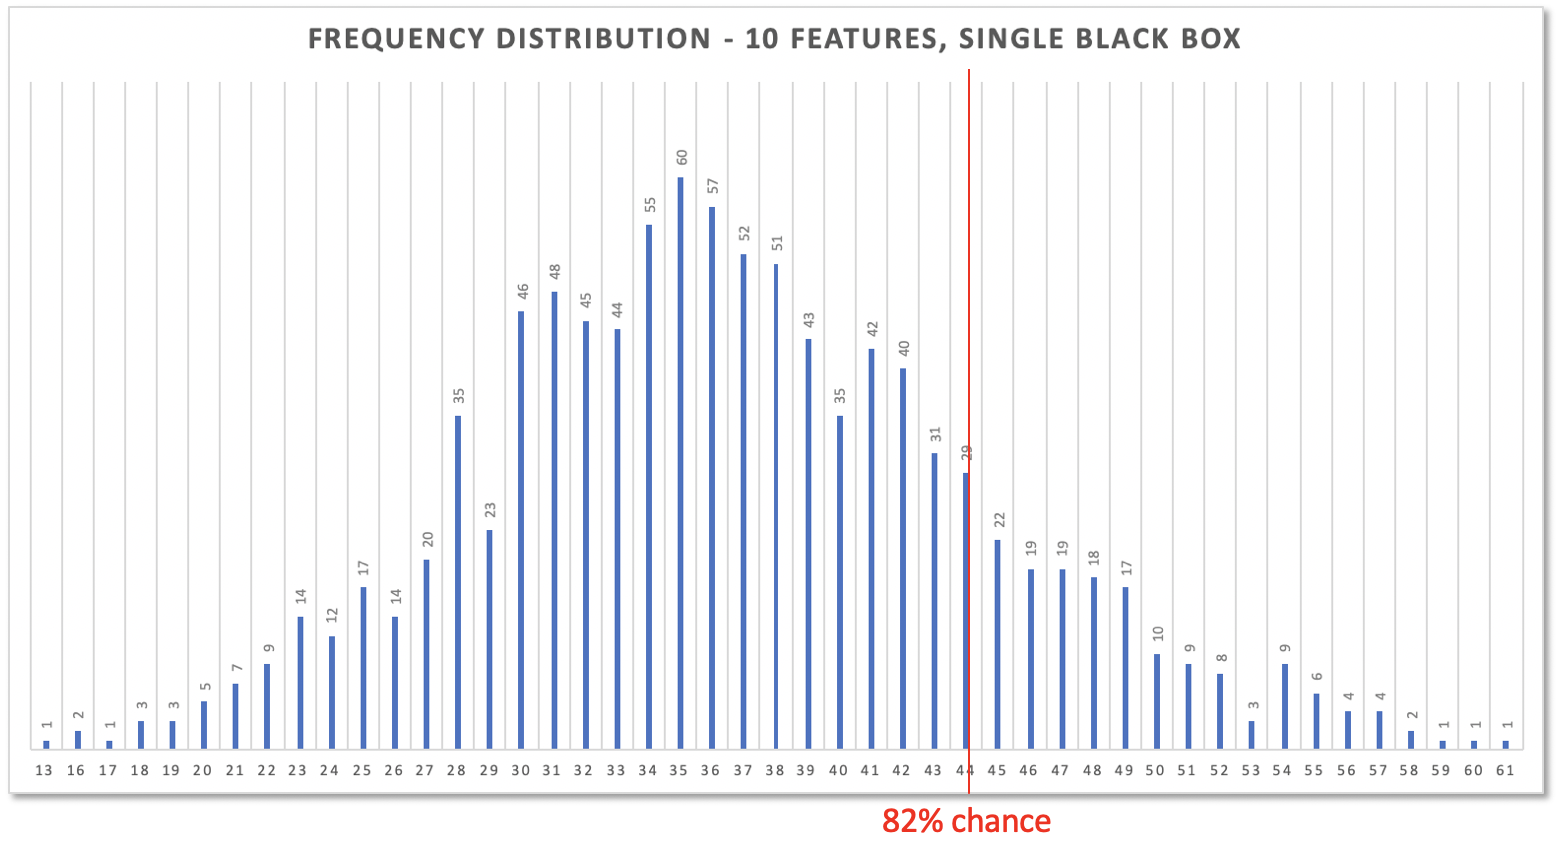
10 features would take 44 days (or less) with a a probability of 82%.
But that does not take into account any work done in parallel. Working independently on multiple features at the same time sure should take less time. But how much less? How to forecast simultaneous work?
Throughput Instead of Cycle Time
When measuring the productivity of several resources the metric switches away from cycle time. When work starts on an issue K it’s not clear if issue K is the next one to get finished (regardless of the cycle time). Maybe issue J or H is the next to be released.
Hence, what’s more interesting than cycle time is throughput: How many features get finished in a period of time (e.g. a day or a week)?
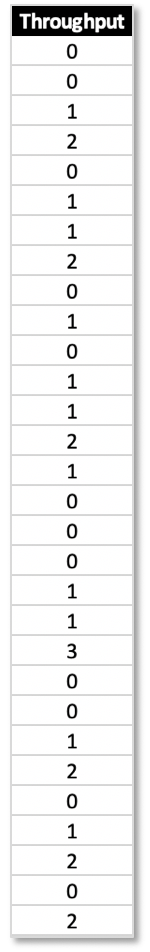
You can get throughput data from your historical cycle time data if you recorded when a work item got fed to a resource (here: issues to multiple black boxes) and when it was „spit out“ finished:
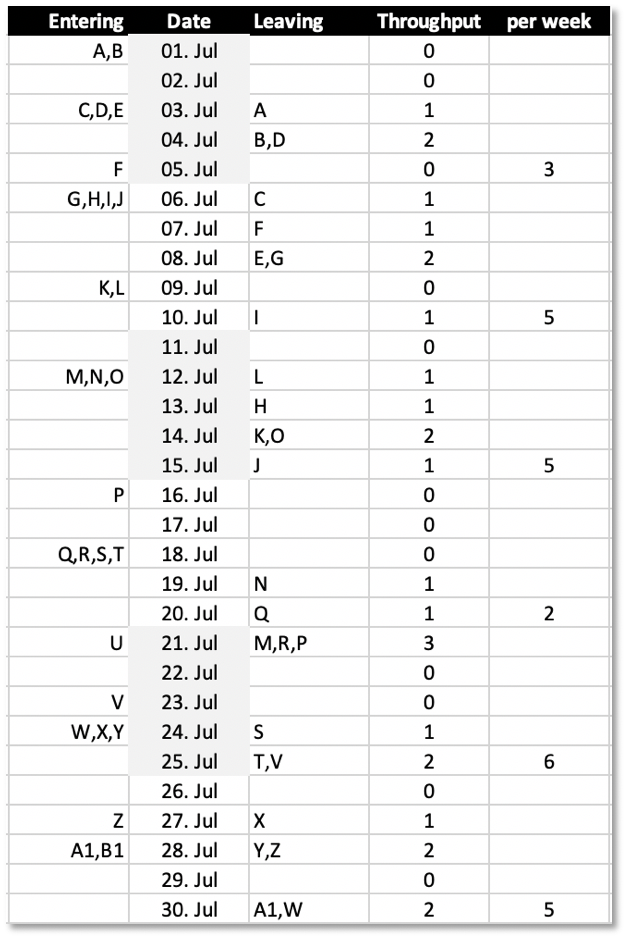
In this excerpt from a cycle time log, for example issues A and B entered „production“ on July 1st, but A left it on July 3rd and B on July 4th. Their cycle times were 3 and 4 days. Other features just took 2 days, e.g. D, others 10 (M). (Never mind that each day on the table seems to be a work day; no weekends included for simplicity.)
Throughput is not interested in how long each issue takes from start to finish, but how many items get processed and leave the system in a given time period.
As you can see, not every day issues got finished according to the above log. But on some days 1 was released, on others 2 or 3.
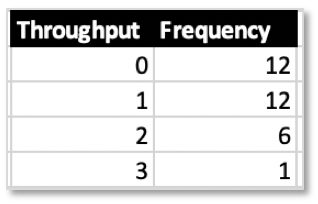
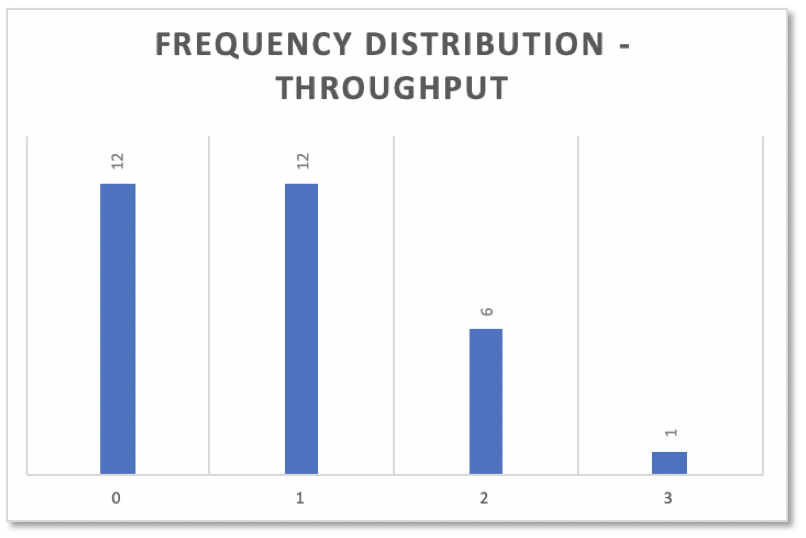
Throughput values like cycle time values thus have a frequency distribution:
Simulating Parallel Work
To simulate the production multiple black boxes can achieve, the approach is slightly different. Frequency values don’t get added, but subtracted. A single simulation looks like this:
Pick a throughput value from the list of historical data in the granularity of the relevant time period, e.g. days or weeks.
Then subtract the value picked from the number of features to implement, e.g. 10 features, 2 got picked, the number of remaining features is 8.
Do this until all features are finished, e.g. for 10 features that could look like this: 2:8, 0:8, 1:7, 0:7, 0:7, 1:6, 3:3, 0:3, 0:3, 1:2: 0:2, 0:2, 3:-1.
The number of picks needed is the number of days required to accomplish the features, e.g. 13.
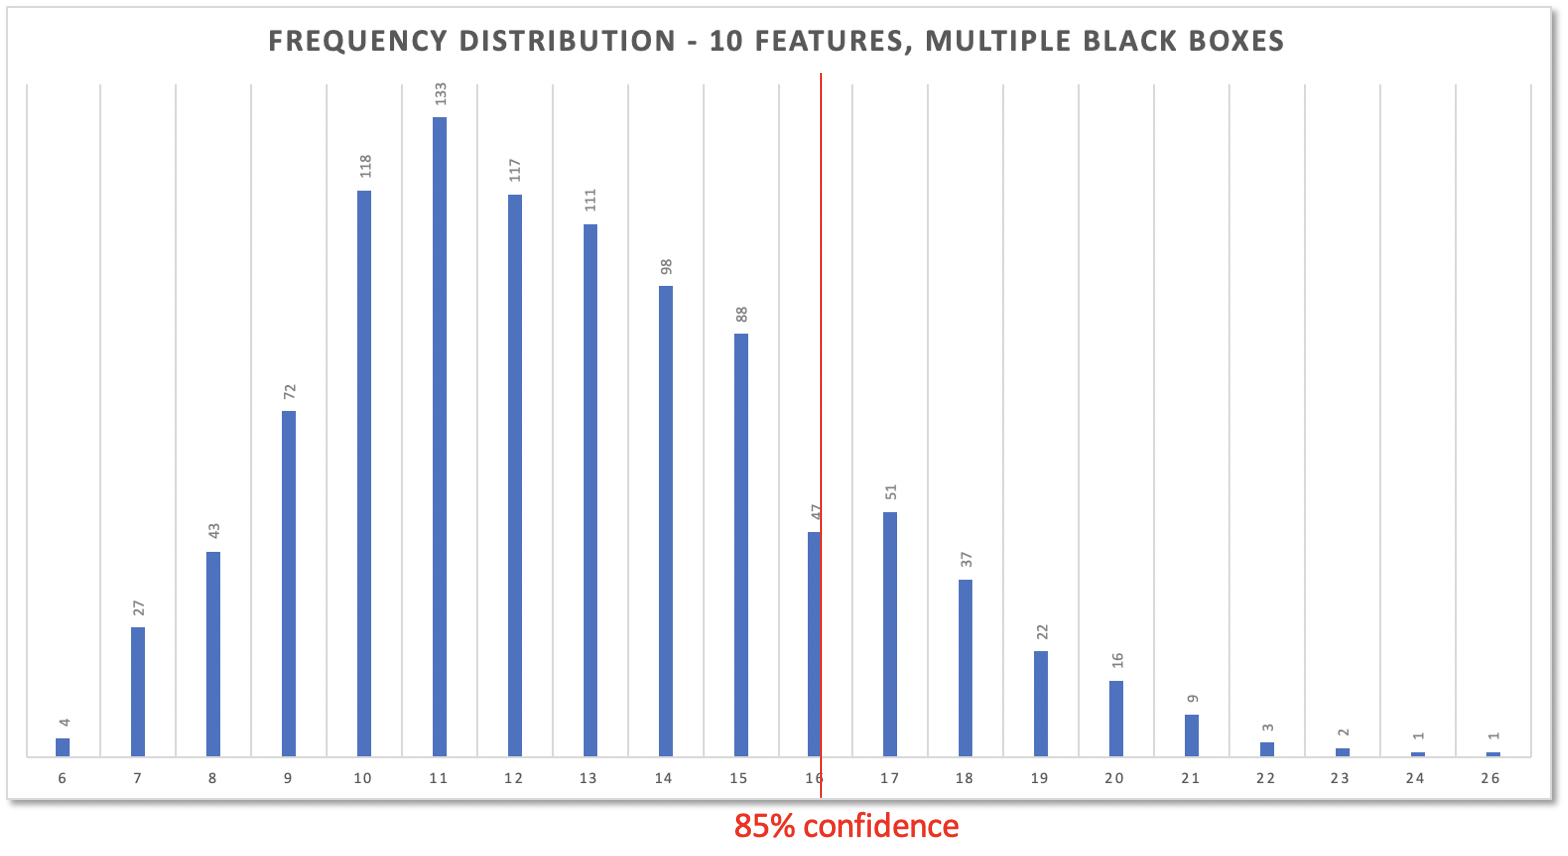
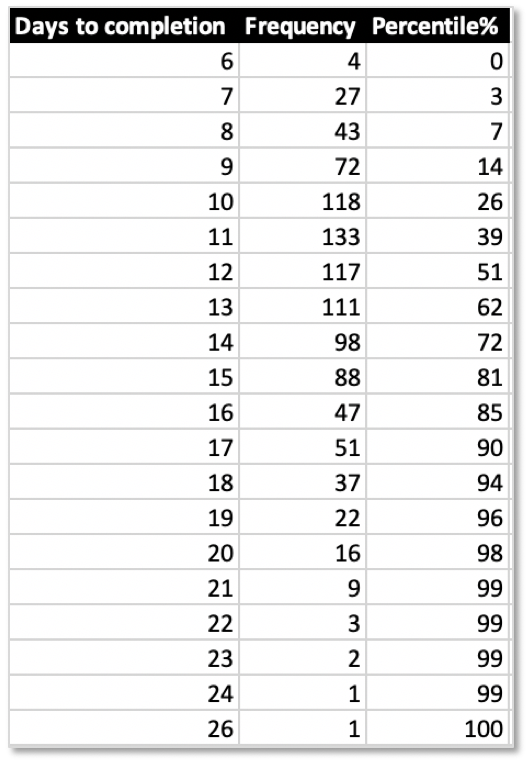
Repeat this a 1000 or more times. The result again is a table of frequencies. But this time they stand for the total number of days needed until completion of the features:
The resulting histogram also again looks almost like a normal distribution:
And based on the percentiles from the table you can highlight the number of days you feel comfortable with for delivering multiple features with multiple black boxes at work. In this case it’s 16 days for 10 features with a risk of 15%.
Please don’t compare these 16 days to the above 44 days for 10 features with a single black box. Both are based on different datasets. They need to, since the above cycle times are just from a single black box. Multiple black boxes sure differ in their cycle time logs; and all those logs get merged. For a forecast it’s not important which black box did what. Only the overall throughput is of interest. The customer does not care which PO with her black box actually works on a feature.
Fin
Can you believe it? Black Boxes happily humming while implementing issues from Github backlogs, but mute, can still be used to deliver on time. You cannot ask them for an estimation - nevertheless you can make a prediction for when multiple features likely will be finished. (With „likely“ being a probability you choose according to your risk attitude.)
Think of all the time and energy saved by not arguing about estimations. Think about the blame avoided because nobody got the padding wrong.
Talking to developers about feature complexity is still worthwhile - but for a different reason. Don’t get prioritization mixed up with prediction.
Talk with developers about complexity and categorization to help you with prioritization.
Don’t talk with developers about estimations. They get it wrong 100% of the time, and everybody is feeling bad sooner or later.
Don’t look into a crystal ball. Look at facts, look at historical data. Do your math! Calculate a probability distribution (or histogram) and pick a number according to the risk you are willing to take. That’s entirely your choice (or whoever wants a prediction anyway).
And then don’t tell the developers about your deadline! That’s crucial. Only that way they will deliver all qualities required: functionality, efficiency, sustainability.
You can even pick two numbers, if you like. The probability distribution is clear. That’s an important improvement compared to any estimation you can possibly get. So pick a number to communicate to the customer, e.g. from the 95% percentile, and another number for internal use, e.g. from the 85% percentile.
After that: Lean back and watch the development unfold… No, don’t lean back. Walk around. Keep yourself informed about the progress towards your personal goal. Actively steer the development with ongoing re-prioritizations, scope reduction, impediment removal.
But don’t take just my work for it. Read the book on it: When Will It Be Done? by Daniel S. Vacanti. There’s more to „predictable software development.“